
Quality Control Inconsistencies in Manufacturing: Identifying and Overcoming the Hidden Threat
One in ten production defects in high‑volume factories costs companies $12,000 on average per unit—yet most quality control inconsistencies in manufacturing go unnoticed until after shipping. In a world where margin compression and customer expectations collide, understanding and eliminating these inconsistencies is not just a best practice—it’s a survival imperative.
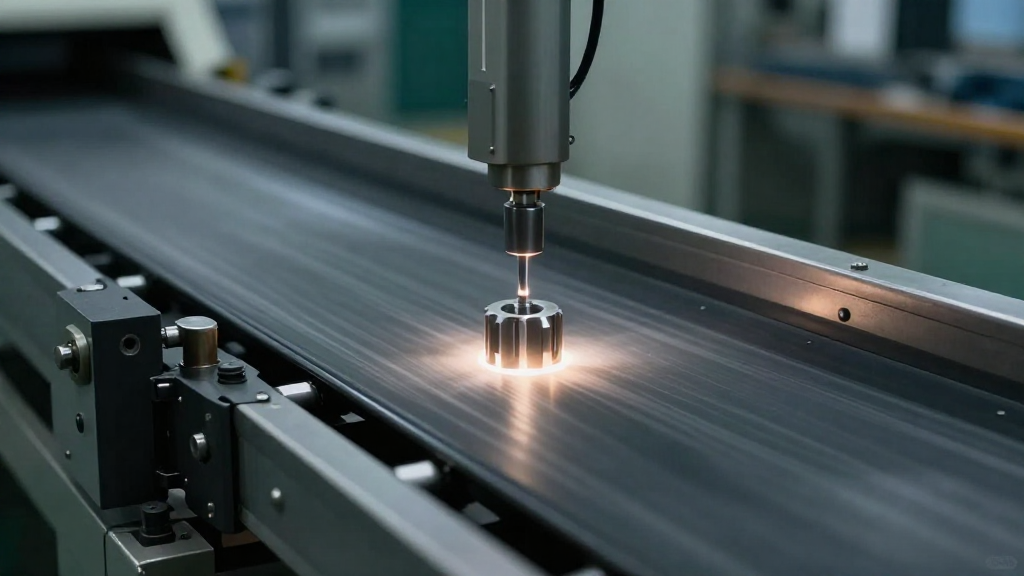
High‑resolution view of a conveyor belt where a sensor flags a defect.
Understanding Quality Control Inconsistencies in Manufacturing
Quality control inconsistencies arise when a product’s measured attributes deviate from the intended specification in a systematic—not random—manner. Hidden process drifts, sensor drift, operator fatigue, and equipment wear are common sources. While a single outlier is often dismissed as a “black‑swallow,” a cluster of outliers signals a deeper, systemic issue.
Impact is multi‑layered
- Operational – Increased rework, scrap, and downtime.
- Financial – Hidden costs that erode profit margins.
- Reputational – Customer complaints, recalls, and brand damage.
Key Takeaway: Even a 1 % rise in defect rate can translate into millions of dollars lost annually in high‑volume operations.
Real‑World Example: Automotive Assembly Line
At a mid‑size automotive supplier, a 0.8 % defect increase in brake‑pad production was traced to a subtle temperature drift in the extrusion oven. The thermostat’s 5 % tolerance margin allowed a 3 °C drop over months, producing a thin‑wall defect that escaped visual inspection. Re‑calibrating the thermostat cut defects by 70 % and saved $1.5 M in rework.
Pro Tip: Deploy a statistical process control (SPC) dashboard that tracks key parameters in real time. Early alerts on drift enable corrective action before defects accumulate.
Root Causes and Impact on Production Quality
Identifying the root causes of QC variability is a cornerstone of continuous improvement in manufacturing quality control. Below are the most common culprits and practical diagnostic approaches.
-
Process Variability – Raw‑material properties, machine settings, or environmental conditions.
-
Diagnostic: Run a Pareto analysis on defect types to isolate the most frequent root causes.
-
Human Factors – Operator fatigue, miscommunication, or insufficient training.
-
Diagnostic: Conduct shift‑by‑shift observation audits and capture operator feedback.
-
Equipment Wear & Calibration Drift – Tool wear, sensor degradation, or misaligned machinery.
-
Diagnostic: Schedule predictive maintenance and perform calibration checks at defined intervals.
-
Data Quality Issues – Inaccurate or incomplete data feeds into analytics systems.
-
Diagnostic: Validate sensor data against manual measurements periodically.
-
Environmental Factors – Temperature, humidity, and vibration can subtly alter outputs.
-
Diagnostic: Monitor ambient conditions with data loggers and correlate with defect spikes.
Mini Case Study: Consumer Electronics Manufacturer
A leading smartphone assembler saw a 2 % rise in screen defect rates. Root cause analysis for QC variability revealed that a new glass supplier’s panels had a higher coefficient of thermal expansion. Coupled with an older screen‑soldering robot, the combination caused warping during cooling. Switching to a tighter‑spec supplier and upgrading the robot reduced defects to 0.3 %, lifting yield from 85 % to 93 %.
Pro Tip: Integrate a cross‑functional team—including process engineers, quality analysts, and equipment specialists—to ensure every angle of variability is examined.
Practical Strategies to Identify and Resolve QC Inconsistencies
Resolving quality control inconsistencies in manufacturing requires a systematic, data‑driven approach that aligns with continuous improvement in manufacturing quality control.
1. Deploy Real‑Time Quality Monitoring Solutions
- Sensors & IoT Devices – Install vibration, temperature, and pressure sensors on critical machines.
- Digital Twins – Create virtual replicas of equipment to simulate conditions and predict drift.
- Automated Alerts – Configure threshold‑based notifications that trigger when parameters deviate from acceptable ranges.
“Real‑time monitoring turns a reactive maintenance culture into a proactive one, catching deviations before they manifest as defects.”
2. Leverage Data Analytics to Pinpoint Root Causes
- Collect – Aggregate machine data, operator logs, and defect records into a unified database.
- Clean – Validate data integrity, remove outliers, and standardize units.
- Analyze – Apply multivariate regression or machine‑learning models to uncover hidden correlations.
- Visualize – Build dashboards that map defect rates against process parameters in real time.
Pro Tip: Fuse predictive analytics with SPC to forecast potential quality issues, allowing pre‑emptive adjustments.
3. Implement a Robust Root‑Cause Analysis Protocol
- 5 Whys – Drill down by repeatedly asking “why.”
- Fishbone Diagram – Map potential causes across material, machine, method, and environment.
- Failure Mode and Effects Analysis (FMEA) – Prioritize risks and design mitigation actions.
4. Apply Lean Six Sigma Tools for Continuous Improvement
| Tool | Purpose | Typical Output |
|---|---|---|
| DMAIC | Define, Measure, Analyze, Improve, Control | Structured problem‑solving cycle |
| Kaizen | Continuous incremental improvement | Reduced waste, improved flow |
| SPC Charts | Statistical monitoring | Early defect detection |
Key Takeaway: A disciplined application of Lean Six Sigma not only fixes current inconsistencies but also embeds a culture of quality into every process step.
5. Establish a Feedback Loop with Suppliers and Customers
- Supplier Quality Agreements – Set clear specifications, inspection criteria, and corrective‑action plans.
- Customer Feedback Integration – Use field data to validate lab tests and adjust specifications accordingly.
6. Maintain a Culture of Continuous Learning
- Training Programs – Regular refresher courses on equipment operation and quality standards.
- Knowledge‑Sharing Platforms – Document lessons learned on intranet portals or collaborative tools.
- Recognition Systems – Reward teams that proactively identify and solve quality issues.

7. Final Control and Verification
- Process Validation – After corrective actions, perform a validation run to confirm stability.
- Audit Trails – Log all changes, approvals, and test results for traceability.
- Continuous Improvement Plan – Schedule regular reviews to assess long‑term efficacy of solutions.
Pro Tip: Start with a pilot implementation of real‑time monitoring on a single high‑risk process. Use the insights gained to scale across the plant, ensuring measurable ROI.
Conclusion
Quality control inconsistencies in manufacturing are not merely statistical noise—they are a silent drain on productivity, profit, and brand equity. By combining real‑time monitoring, data‑driven analytics, rigorous root‑cause analysis, and a culture of continuous improvement, operations managers, QC specialists, and engineers can turn these hidden threats into opportunities for excellence.
Download our Technical Guide to Improving Quality Control in Manufacturing and equip your team with the tools to eliminate variability, boost yield, and secure a competitive edge in today’s fast‑paced production landscape.
The future belongs to those who can predict, prevent, and perfect every part they produce.
Leave a Reply